Introduction
As a penetration tester, I often rely on BloodHound to assist me in Active Directory engagements. However, after a few of them it was clear that I was repeating the same actions (hence the same queries) over and over again. I felt that doing this initial process manually was not just time consuming but also introduced the possibility to make mistakes and miss some low-hanging fruits, this is especially true while analysing a considerable number of domains in a restricted amount of time.
Today we’re going to expand the concept of BloodHound Jupyter notebooks introduced by Cyb3rWard0g in Jupyter Notebooks for BloodHound Analytics and Alternative Visualizations; the aim of this post is to formalise and implement reproducible playbooks to help both red and blue team members saving time while performing analysis of their environments. Starting from the conclusion of Cyb3rWard0g’s post, I made the following considerations that eventually ended up being the foundation of this project:
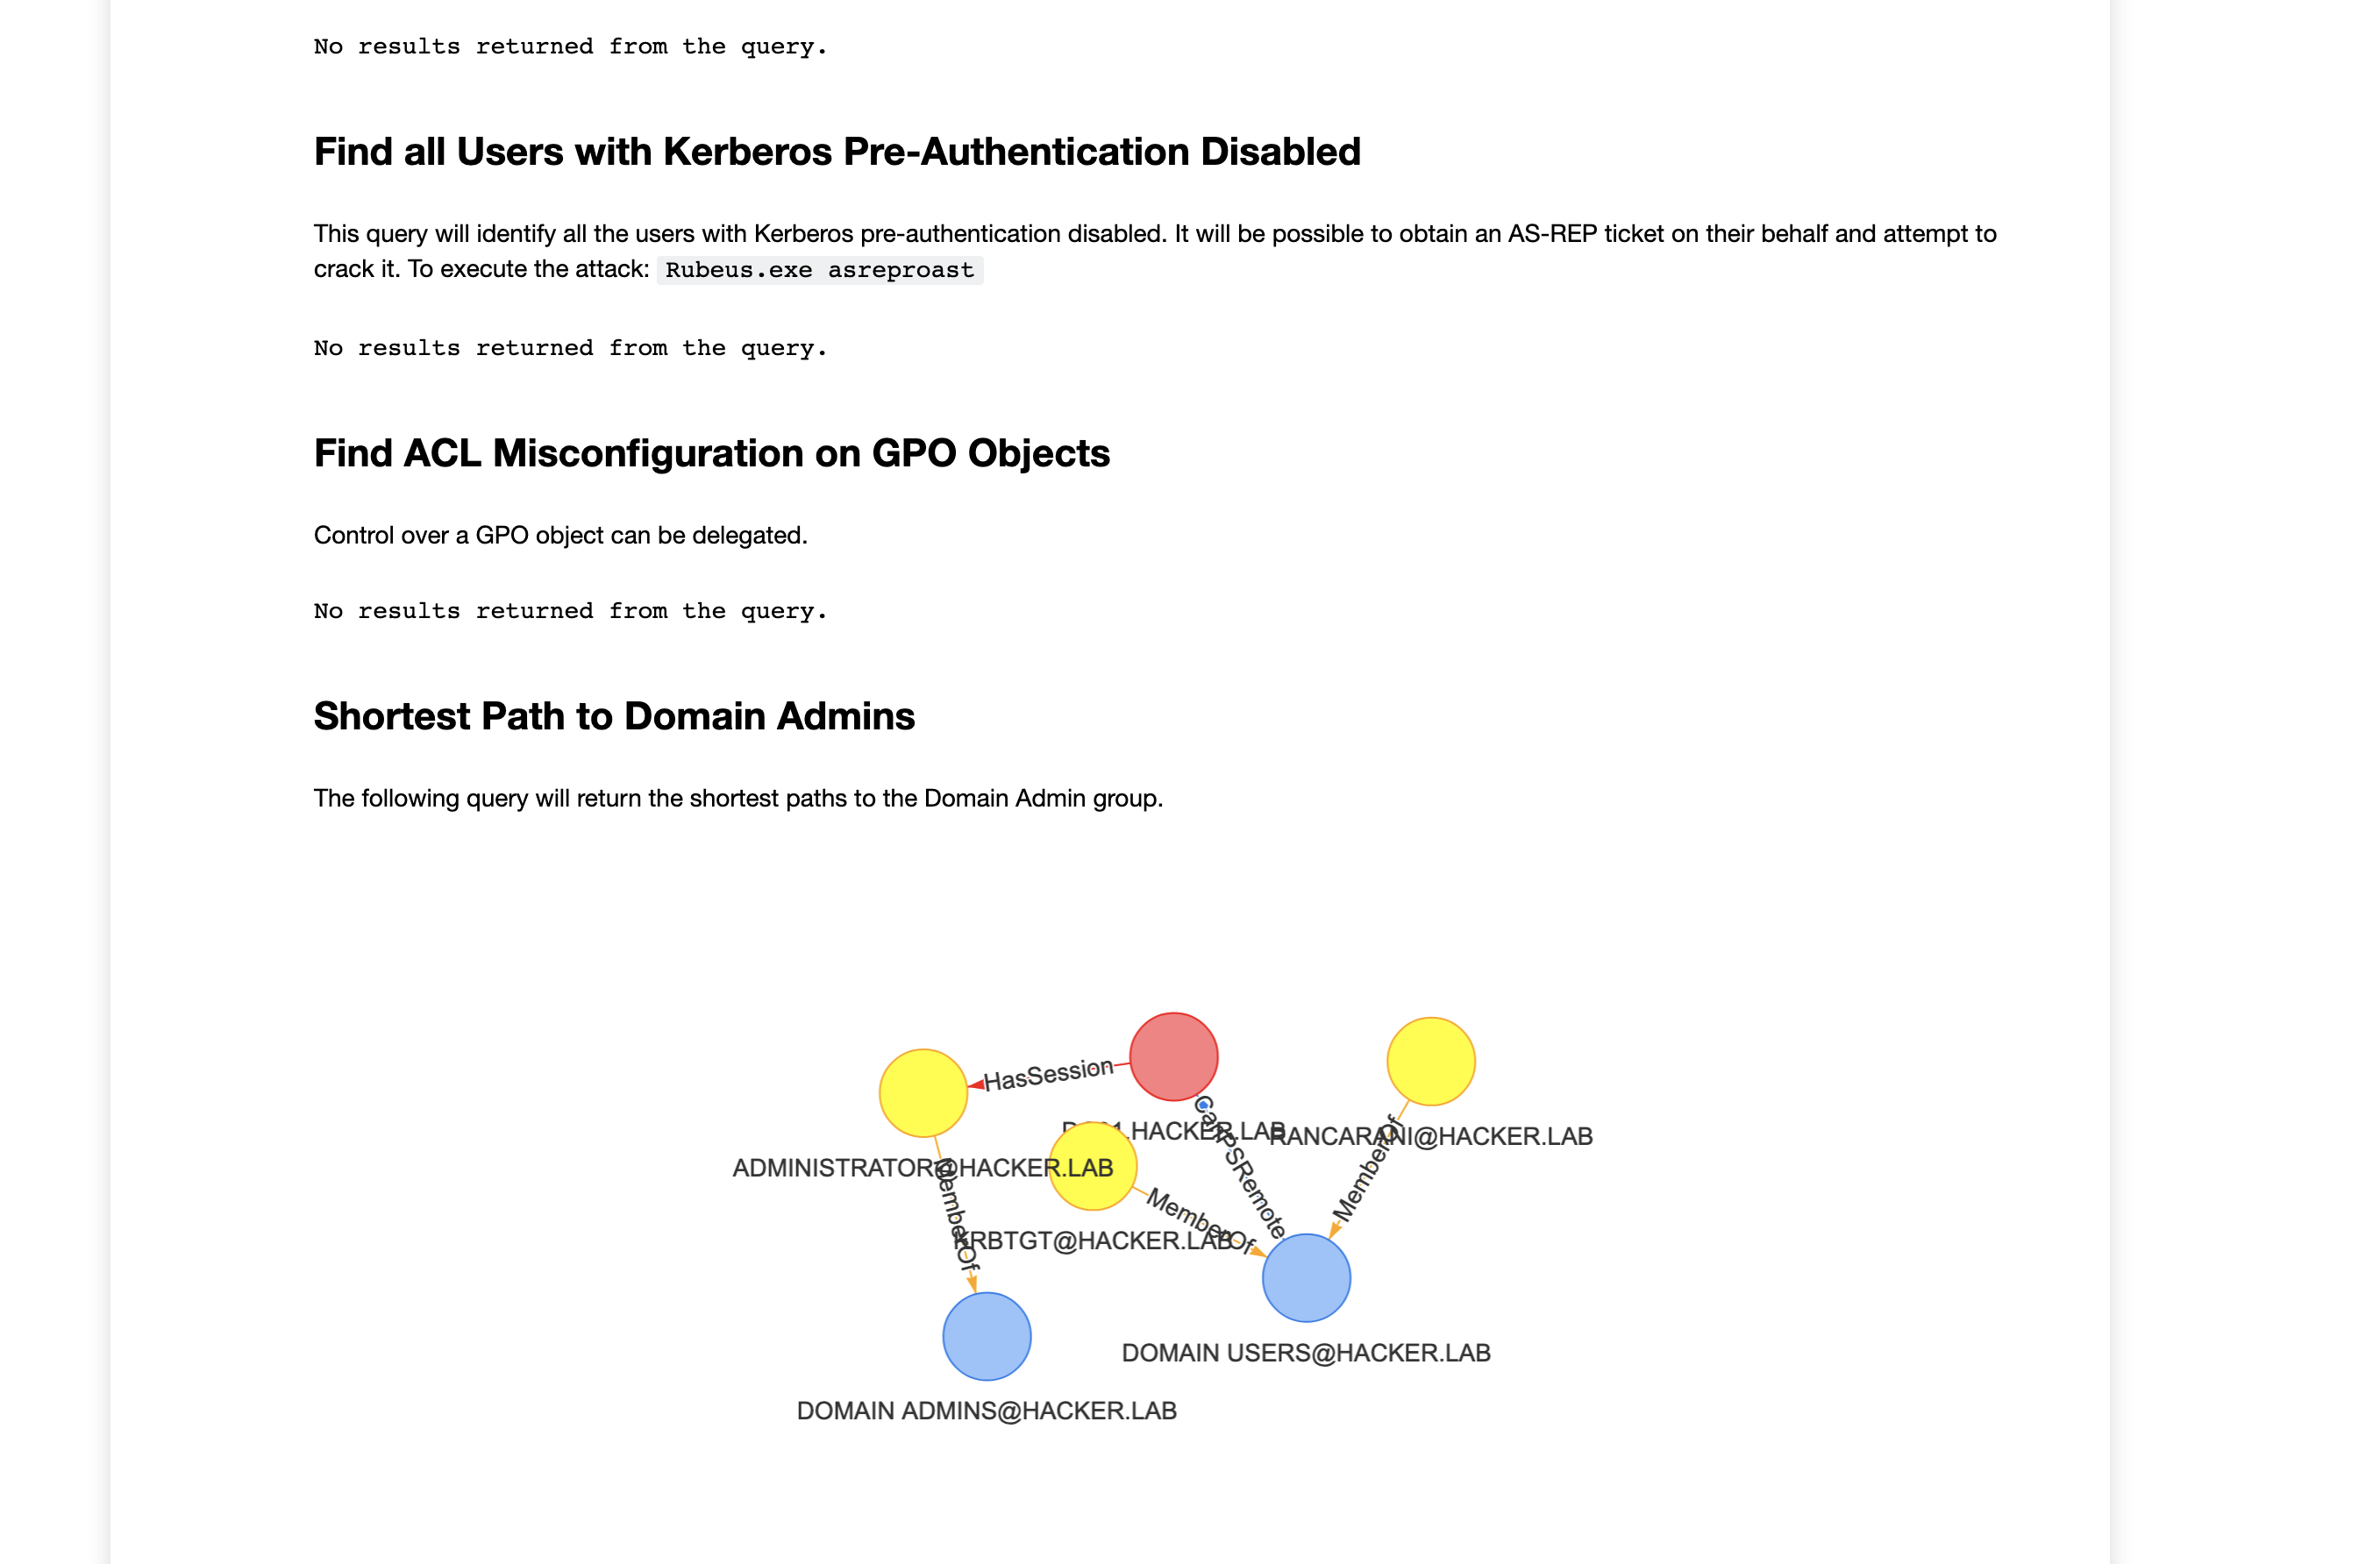
- Jupyter is not very efficient for exploratory analysis as it requires to write python code and Cypher. The bloodhound UI + neo4j browser, in my opinion, are much faster for that task as you only need Cypher and you can rely on the BH UI’s functionalities like path finding and pre-built queries. That’s why in the proposed approach we’ll use Jupyter only for generating the HTML report like the one shown in the figure below:
- Ease of use. It’s not very convenient to manually edit your Jupyter notebook when you want to add a query, right? What I wanted was a solution that would allow me to write queries without touching the python code itself or editing the notebook. With the solution I implemented you will only need to write a YAML file like this one:
name: Find all Domain Admins
type: table
description: Find all users part of the Domain Admins group
query: |
   MATCH (u:User)-[:MemberOf*1..]->(g:Group)
   WHERE g.name starts with 'DOMAIN ADMINS'
   RETURN u.name
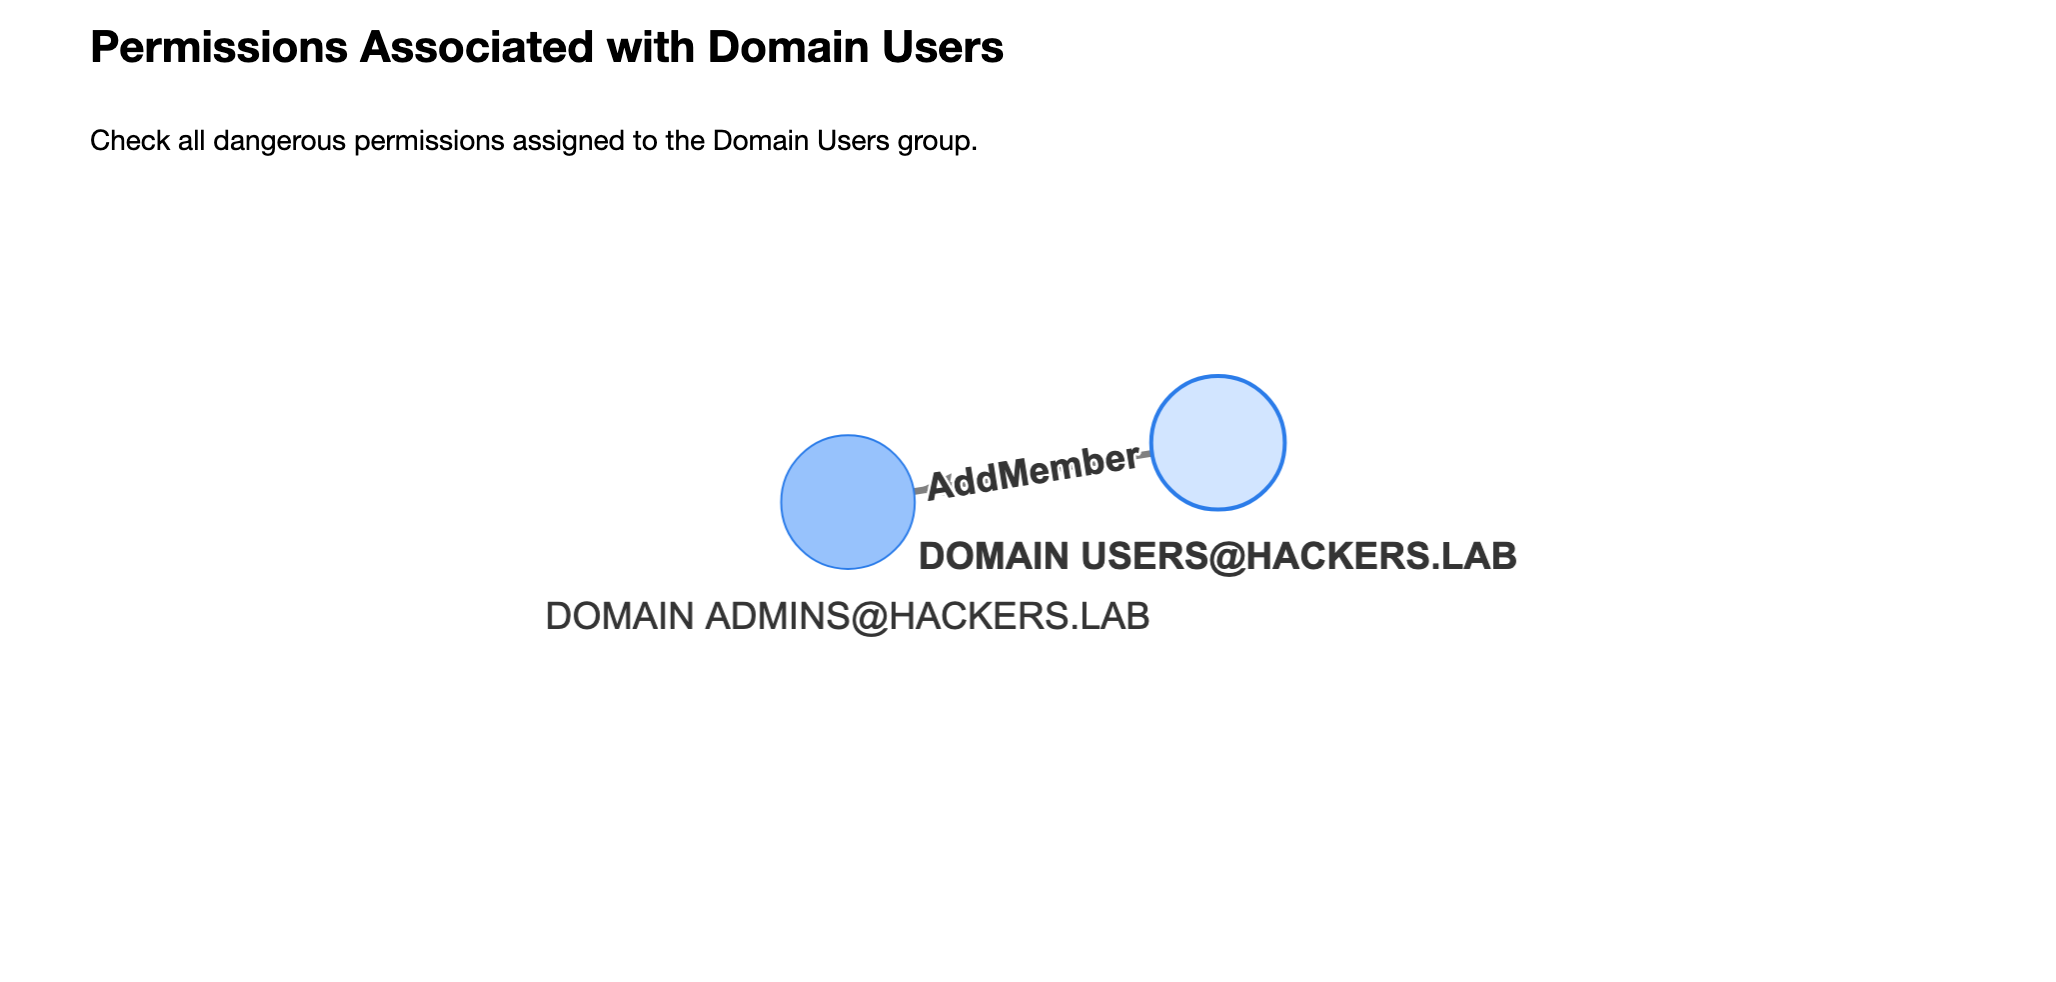
- I wanted to see graphs in my notebooks as well! While tables and charts are useful, the true power of BloodHound lays in graphs!
Implementation
I used the vis.js library to plot graphs within the notebooks, luckily enough I found some code snippets from here: neo4j-jupyter-hello-world
However, the proposed code was not working properly with the latest version of py2neo (the high level python interface to neo4j) and therefore I had to tweak it a little bit. The final code responsible for the graph rendering can be found here.
Another very important characteristic that my project had to have was that I shouldn’t always edit the notebook’s code in order to add new queries. The approach that I followed was to use the nbformat library that allows you to programmatically create python notebooks.
What I did was creating templates for the various types of queries I wanted to make, for example for plotting a table I used the following code:
table_query_template = """\
res = g.run(\"\"\"
{}\"\"\").to_data_frame()
if not res.empty:
    print(res)
else:
    print("No results returned from the query.")
"""
That allowed me to decouple the creation of a cypher query to the python implementation and plotting. The result is that you can define cypher queries in YAML files like the one shown in the Introduction section and the software will take care of the rest.
At the time of writing, I implemented only the graph and the table templates, more than enough for my objectives.
If you inspect the code of the run-playbook.py code, you’ll see that it will create a notebook file called results.ipynb, which is the notebook with all the templates filled with the appropriate queries. In order to run the notebook and export the result to HTML you can use this command:
jupyter nbconvert result.ipynb --to html --no-input
--to htmlis used to produce an HTML report, for easier distribution of the results;--no-inputis used to omit the python code and just show the results, it was a personal choice to remove the python code as it was not adding any value to the results.
This will create a results.html file with your report:
Usage
In order to generate your own notebooks, you have two choices:
- Run the python code locally;
- Build the docker image.
To run locally, clone the git repo and activate the python virtual environment:
git clone https://github.com/RiccardoAncarani/bloodhound-playbook.git
cd bloodhound-playbook
pipenv shell
pip install -r requirements.txt
Set the appropriate environment variables to connect to the neo4j backend:
export NEO4J_HOST=127.0.0.1
export NEO4J_USERNAME=neo4j
export NEO4J_PASSWORD=<your password>
You can inspect, add or edit the queries description in the queries/ directory and when you’re happy with it you can generate and execute the notebook with ./run-playbook.sh
You can alternatively use the Docker image I built:
docker pull riccardoancarani/bloodhound-playbook
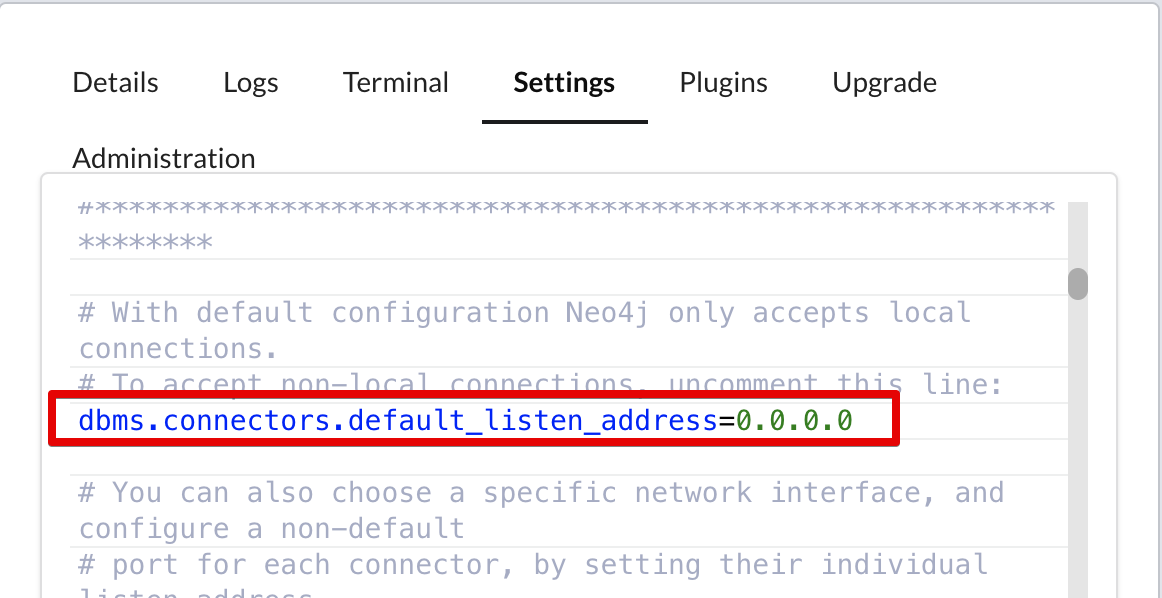
The only drawback of using Docker is that you have to change the configuration of the neo4j server in order to accept remote connection from other interfaces (or use the --network=host flag, but it doesn’t work on macOS). To do so, simply uncomment the dbms.connectors.default_listen_address line in the neo4j configuration file:
Run the container:
docker run --rm \
 -v /tmp:/usr/src/app/output \
-v $(pwd)/queries:/usr/src/app/queries \
-e NEO4J_HOST=<HOST> \
-e NEO4J_USERNAME=neo4j \
-e NEO4J_PASSWORD=<PASSWORD> \
-it riccardoancarani/bloodhound-playbook
Where:
-v /tmp:/usr/src/app/outputmaps the output directory where the program create the final report, always calledresult.html;-v $(pwd)/queries:/usr/src/app/queriesmaps the directory with all the queries to execute;-e ..sets the environment variables to connect to the neo4j server;
If you want to customise the queries or add your owns, the syntax is quite easy:
name: name of the query
type: [graph, table]
description: a brief description of the query, supports markdown
query: the cypher query
For queries, the queries/ directory contains some examples.
Conclusion
While this post is merely a confused introduction, this approach will hopefully make easier for both attackers and defenders to create reproducible bloodhound playbooks. You can customise and adapt this in many ways, a few ideas:
- As an attacker, you can have playbooks to quickly identify misconfigurations in target environments;
- As a defender, you can craft your own set of queries to evaluate the “health” status of your domain. The playbook can be executed multiple times (after running bloodhound again) to identify improvements.
A big thanks to Roberto Rodriguez for his efforts on showing the power of Jupyter notebooks to the infosec community.